Free template
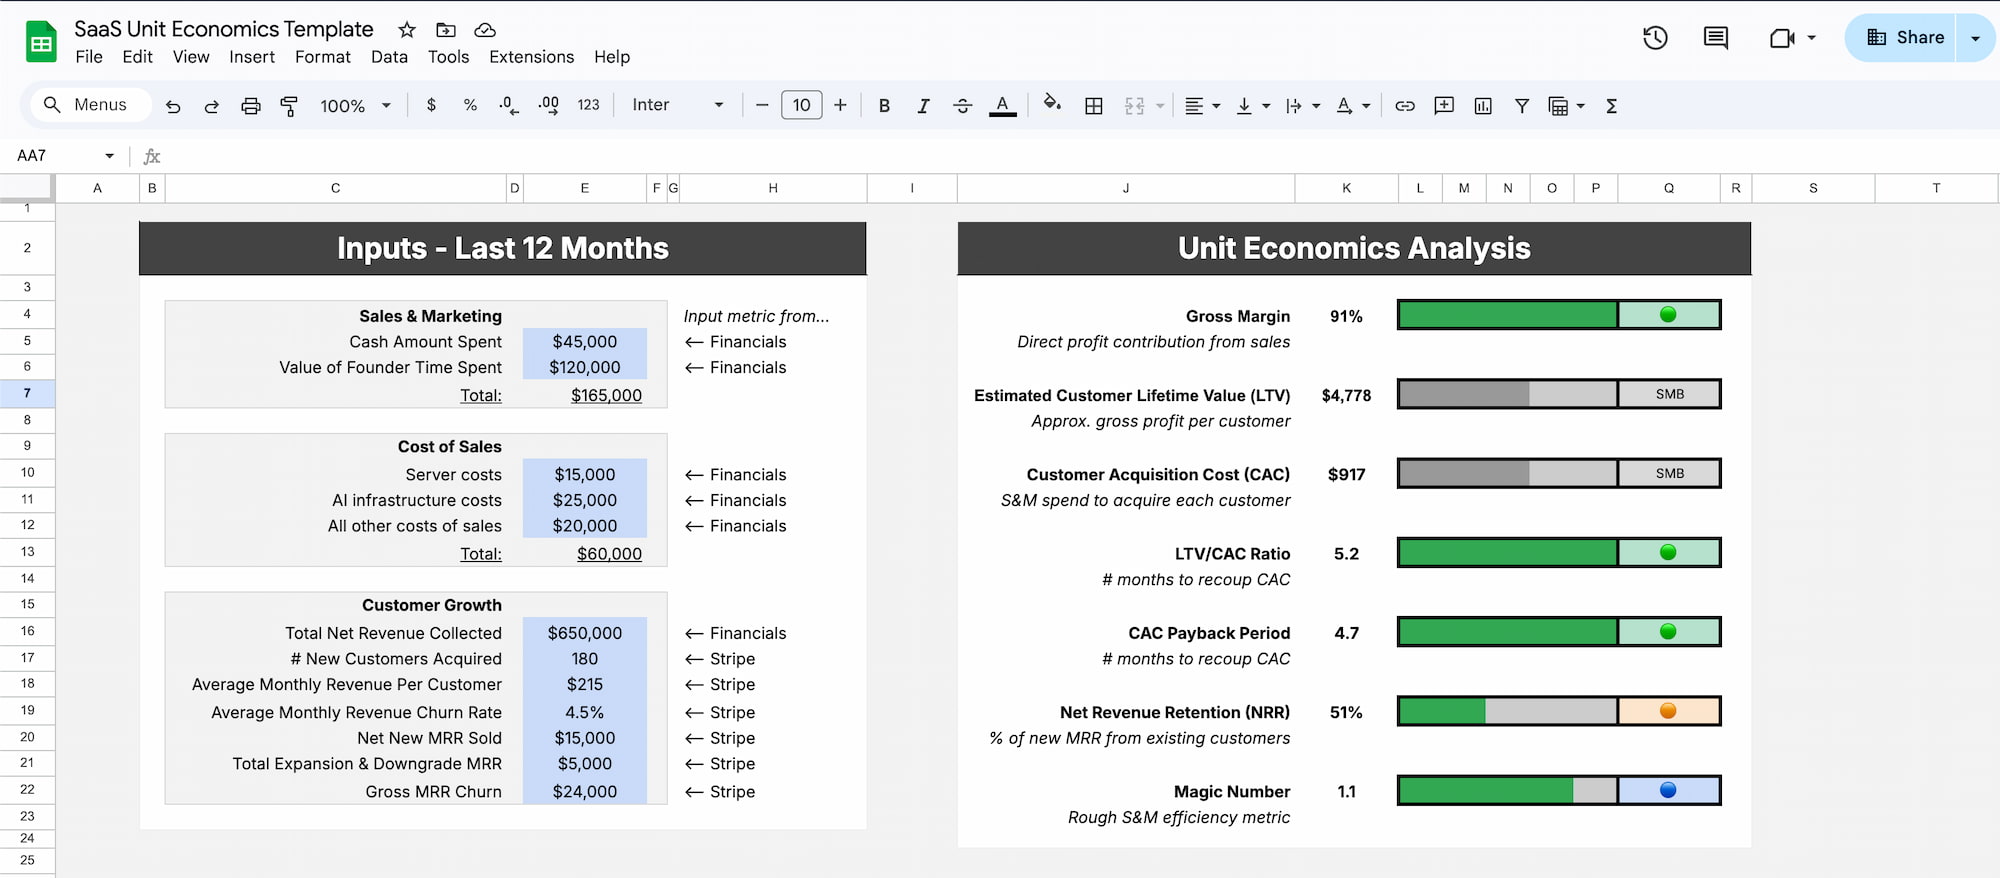
Calculate CAC, LTV, payback period, and profitability metrics for your SaaS business in minutes. Google Sheets template with built-in formulas and examples.
The term 'unit' economics in SaaS refers to the gross revenues, and profit contribution, per 'unit' sold. Usually in this context a 'unit' means a new customer, but it can also mean a seat or license.
The most important metrics include Customer Acquisition Cost (CAC), Lifetime Value (LTV), CAC payback period, and the LTV:CAC ratio. Together, these numbers tell you if you're spending wisely to acquire customers who will generate profitable returns.
But what do you do if, like most SaaS companies, you don't have an exact idea of your LTV? LTV takes years to fully understand and is a moving target, after all. So you should also pay attention to Gross Profit Margin % by product and overall, and also your cost to acquire customers, broken down by customer segment.
You might find that you are either super-underinvesting in marketing, or you're scaling a business unprofitably, or anything in between those two ends of the spectrum!
Explore the template structure and see how the calculations work before downloading.
The total cost of acquiring a new customer, including all sales and marketing expenses.
The total revenue you expect to generate from a customer over their entire relationship with your business.
Shows how much value you generate relative to the cost of acquiring a customer. A healthy ratio is 3:1 or higher.
The number of months it takes to recover your customer acquisition costs through gross profit.
The predictable revenue your business generates every month from subscriptions.
The percentage of customers who cancel their subscriptions each month.
Measures revenue growth from existing customers through upsells, cross-sells, and expansion minus churn.
The percentage of revenue remaining after accounting for direct costs of delivering your service.
Sales efficiency metric showing how much revenue growth you generate for every dollar spent on sales and marketing.
A benchmark for SaaS health: growth rate plus profit margin should exceed 40% (this requires founder market rate compensation to be included in expenses).
Once you've calculated your metrics, you need to interpret them. Here's what healthy SaaS unit economics look like:
| Metric | Good | Acceptable | Concerning |
|---|---|---|---|
| LTV:CAC Ratio | > 3:1 | 2:1 - 3:1 | < 2:1 |
| CAC Payback Period | < 12 months | 12-18 months | > 18 months |
| Monthly Churn | < 3% | 3-5% | > 5% |
| Gross Margin | > 80% | 70-80% | < 70% |
| Net Revenue Retention | > 110% | 100-110% | < 100% |
| Magic Number | > 1.0 | 0.75-1.0 | < 0.75 |
If your metrics fall into the "concerning" range, focus on improving those specific areas before scaling growth. Poor unit economics get worse at scale, not better.
A healthy LTV:CAC ratio is 3:1 or higher, meaning you generate at least $3 in lifetime value for every $1 spent on customer acquisition. Ratios below 2:1 indicate you're spending too much to acquire customers relative to their value, while ratios above 5:1 might suggest you're under-investing in growth.
Review your unit economics monthly to track trends and catch problems early. Most successful SaaS companies have a monthly dashboard that includes these metrics alongside other key performance indicators.
Focus on three areas: reduce acquisition costs through more efficient marketing channels, increase pricing to improve unit economics, or decrease churn to extend customer lifetime. Start with the lever that's easiest to move for your business.
Yes, the underlying metrics apply to both B2B and B2C SaaS businesses. However, benchmark values differ significantly—B2B typically has higher CAC but also higher LTV, while B2C usually has lower CAC but higher churn rates.
Start by analyzing which channels drive the most efficient customer acquisition. Double down on high-performing channels, eliminate or optimize underperforming ones, and consider product-led growth strategies that reduce reliance on expensive sales and marketing spend.
CAC should include all sales and marketing expenses: advertising spend, sales team salaries and commissions, marketing software costs, agency fees, and any other costs directly related to acquiring new customers. Don't forget to include fully-loaded costs (salaries plus benefits).
Enter your email to receive instant access to the SaaS Unit Economics Template. Join our community of founders and get exclusive resources delivered to your inbox.
This template was built by the team at Wildfront, a SaaS acquisition firm that has evaluated hundreds of SaaS companies and completed multiple successful exits. We use these exact metrics to assess potential acquisitions and help portfolio companies improve their unit economics.
Our experience analyzing businesses ranging from $1K to $1M+ MRR has given us deep insight into what drives sustainable SaaS growth. This template reflects the real-world metrics we track across our portfolio.