Free template
Plan growth, stress test assumptions, and track core SaaS metrics in one Google Sheet. Built for founders who need a practical model they can actually use every month.
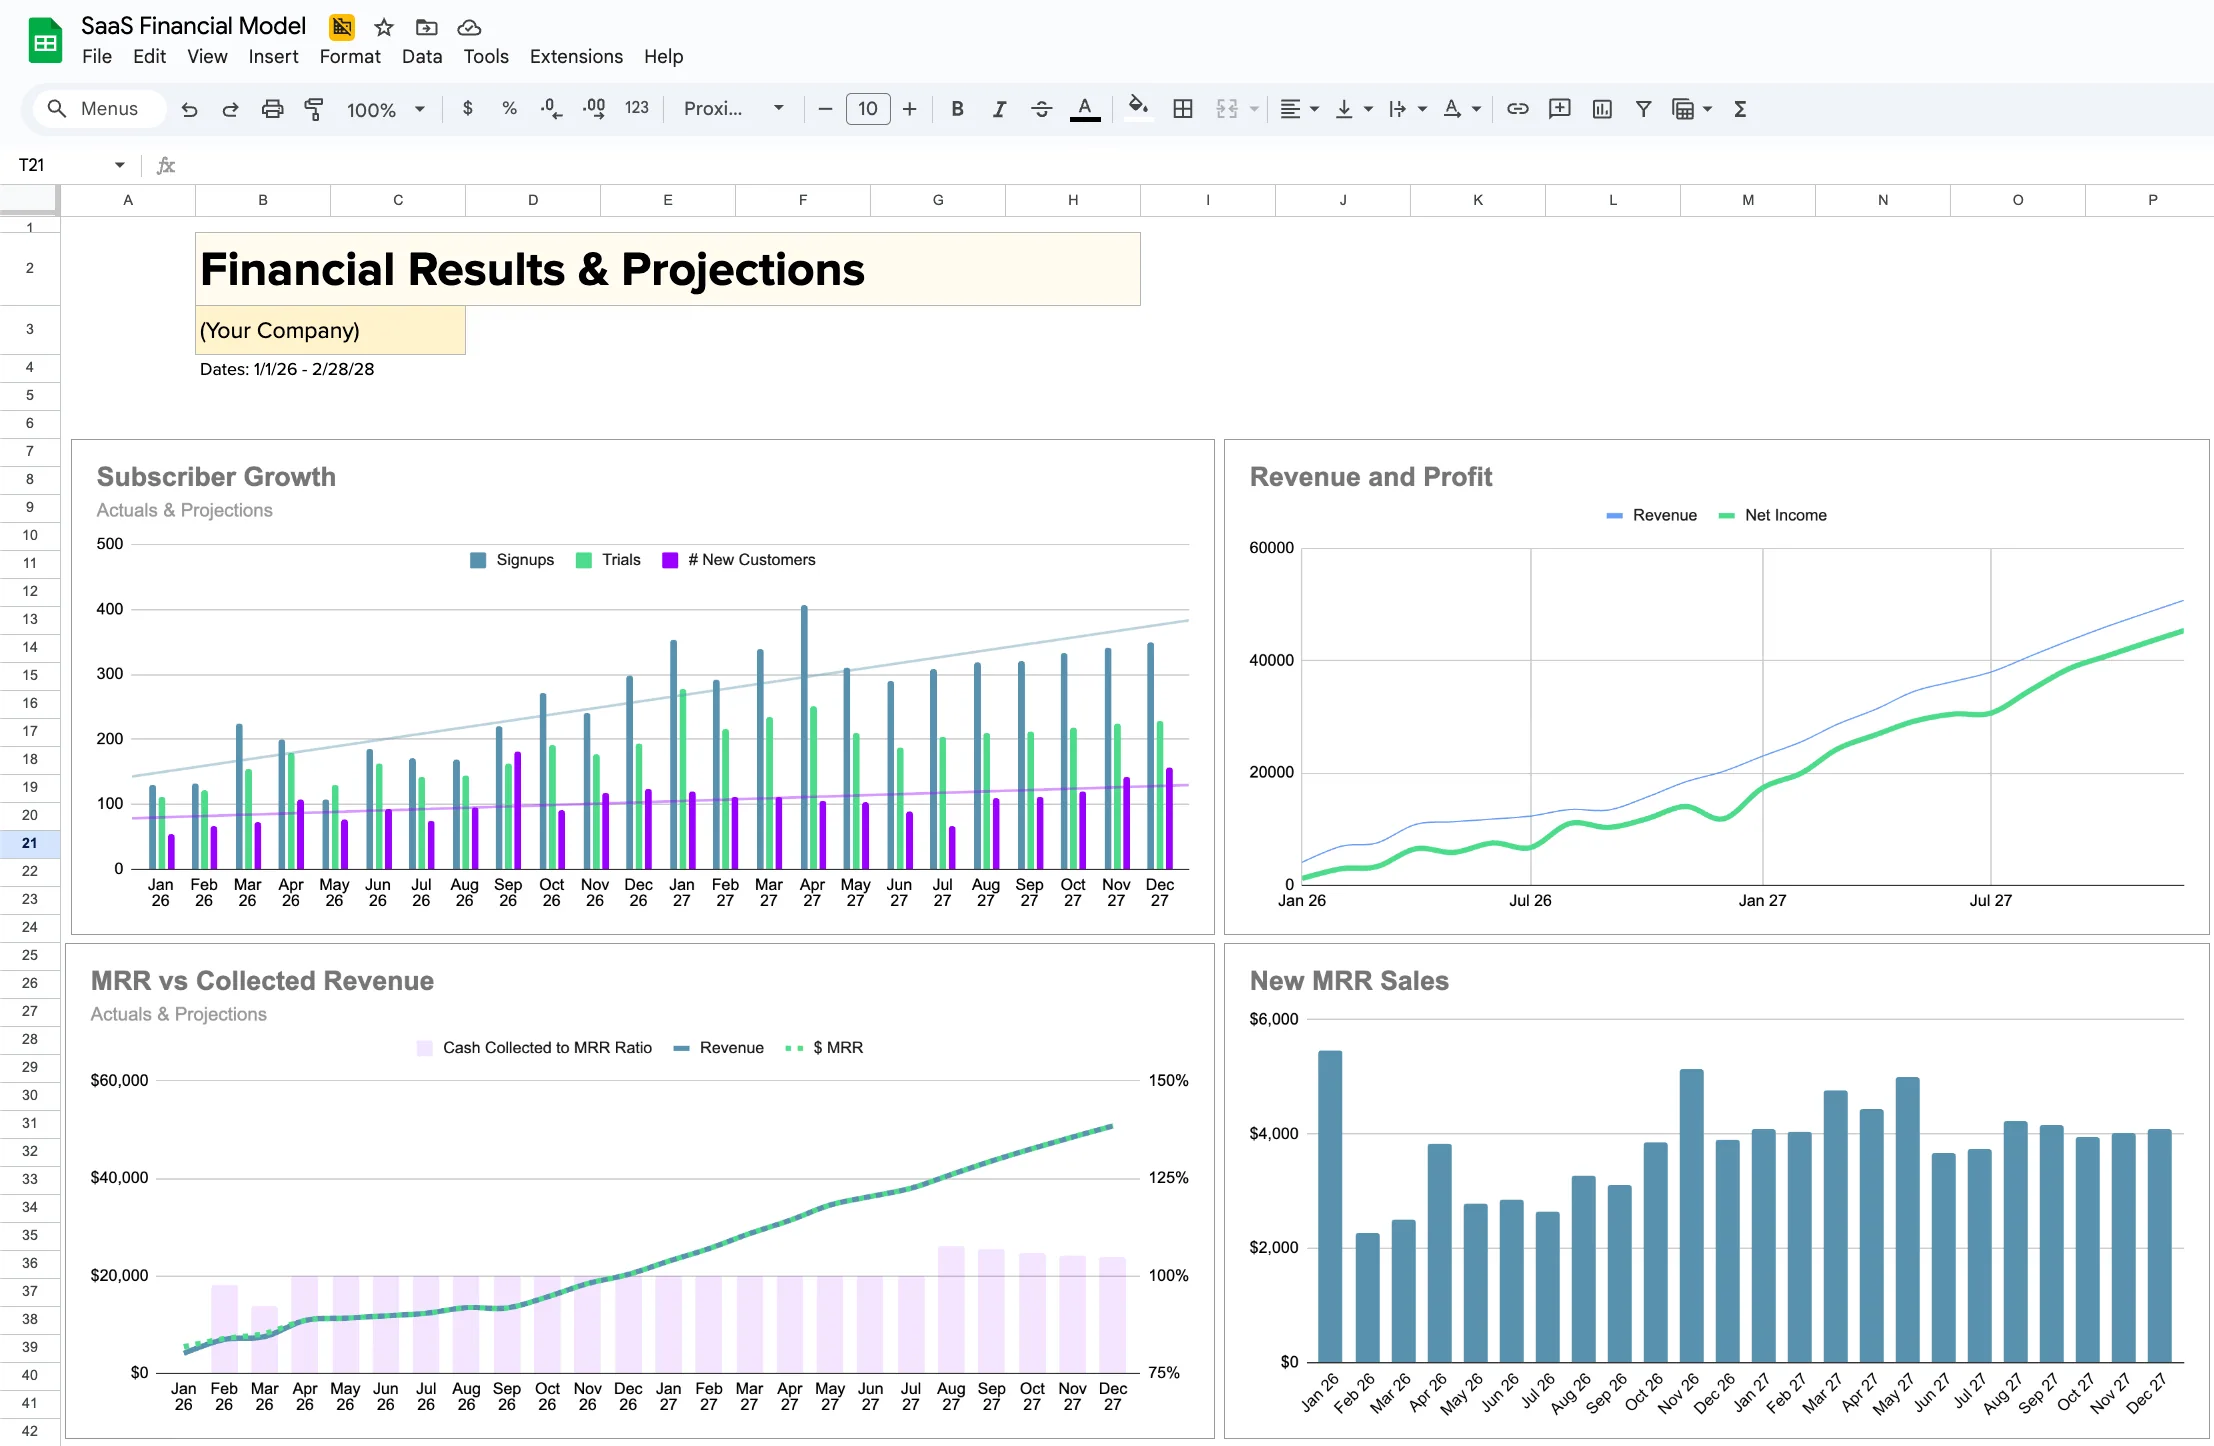
A SaaS financial model is a working spreadsheet that links your core growth assumptions to operating outcomes like net income, cash needs, and payback period.
Instead of managing disconnected reports, you can see how revenue, churn, conversion rates, and cost structure move together month by month. That helps you make better decisions on hiring, marketing spend, and growth pacing.
This template is designed for practical use. Add your actuals, update assumptions, and use the model to forecast outcomes before making expensive decisions.
Total top-line revenue tracked across periods so you can forecast growth and validate targets.
Your recurring subscription revenue base, tracked as the core signal of SaaS momentum.
Direct costs tied to acquiring and closing revenue, useful for understanding true acquisition efficiency.
Tracks infrastructure costs so margin pressure is visible as usage and customer count grow.
Monitors customer or revenue churn so retention risk is surfaced early in your model.
Average Revenue Per User helps you track pricing power and plan expansion revenue assumptions.
Measures what portion of revenue is paid to affiliate channels so partner economics stay healthy.
Bottom-line profitability after operating expenses, used to pressure-test sustainability.
Tracks conversion across key funnel stages so you can model growth levers with more accuracy.
Compares what you pay to acquire customers against their expected lifetime value.
Shows how quickly customer acquisition spend is recovered through gross profit.
Measures cash coverage relative to recurring revenue so runway and risk are easier to assess.
Tracks founder/owner distributions so withdrawals stay aligned with operating performance.
Because this template lives in Google Sheets, it's directly addressable via the Google Sheets API — which means Claude Code can read from and write to it programmatically. If you already have a Stripe account (or any other data source with an API), you can wire up a simple Claude Code workflow that pulls your latest revenue, churn, and subscriber data and refreshes the model inputs on demand.
You don't need to write the integration from scratch. Describe what you want in plain English — "pull last month's MRR from Stripe and update my financial model" — and Claude Code will generate the script, handle auth, and run it. The same pattern works for other sources: Chargebee, ProfitWell, QuickBooks, or any tool that exposes an API.
Use these benchmark ranges as directional checks while reviewing your model outputs:
| Metric | Good | Acceptable | Concerning |
|---|---|---|---|
| LTV:CAC Ratio | > 3:1 | 2:1 - 3:1 | < 2:1 |
| Payback Period | 2-5 months | 6-12 months | 13-18 months |
| Monthly Churn | < 3% | 3-5% | > 5% |
| Net Income Margin | > 50% | > 30% | > 20% |
If multiple metrics are in the concerning range, reduce burn and improve retention before pushing aggressive growth spend.
Enter your email to receive instant access to the SaaS Financial Model Template. Join our community of founders and get exclusive resources delivered to your inbox.
Founders, operators, and finance leads at SaaS companies who need a clear monthly view of growth, profitability, and cash position.
Yes. The model supports both. You can adapt assumptions around ARPU, churn, funnel conversion rates, and sales cycle length for your go-to-market motion.
Update it monthly with actual results and refreshed assumptions. That gives you better forward visibility and cleaner decision-making.
Yes. The model tracks CAC and LTV together and calculates payback period so you can assess growth efficiency over time.
Yes. Owner distribution tracking is included so you can monitor withdrawals against profitability and cash coverage.
Yes. Affiliate commission percent and funnel conversion rates are editable, so you can run realistic channel and acquisition scenarios.
Both. The template is built in Google Sheets, but it's fully compatible with Microsoft Excel — download it as an .xlsx file and all formulas carry over. Most founders prefer Google Sheets for the real-time collaboration and Sheets API access, but the model works either way.
This model was assembled by the team at Wildfront, a SaaS acquisition firm that has evaluated hundreds of companies and completed multiple exits. We use this same lens to assess growth quality and financial resilience.
Our experience with SaaS businesses from early traction to scale informed the exact metrics included here, so you can plan with practical operating context instead of generic benchmarks.